November
Tables, Weighted Insights, and More
This month’s updates offer new ways to visualize and prioritize your feedback.
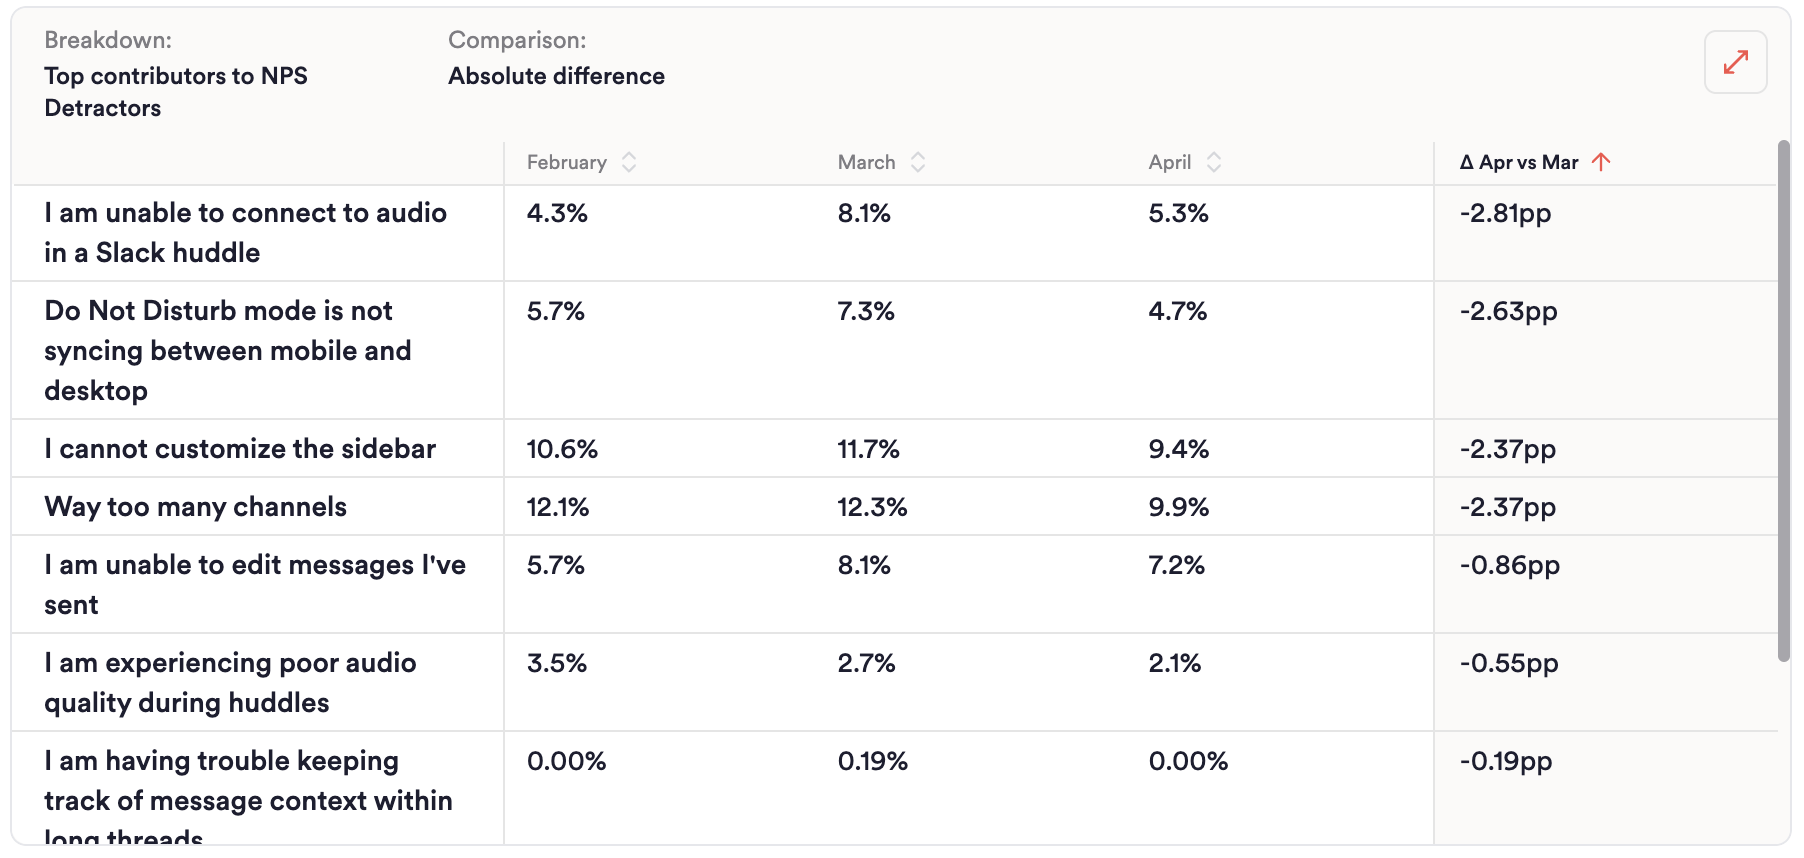
Tables - A powerful way to visualize your data
Say hello to Tables, our newest chart type designed to make it easier than ever to track and compare data over time. Tables help you track the metrics that matter most, week over week, and are best for running regular business reviews.
Add a “Total Volume” column to instantly see the overall sample size for each row. Need to understand performance shifts? Use the Comparison feature to measure the delta between your latest time periods, whether as an absolute difference or percentage change, allowing you to see the largest movers and shakers.
Tables are available to you on all Boards.
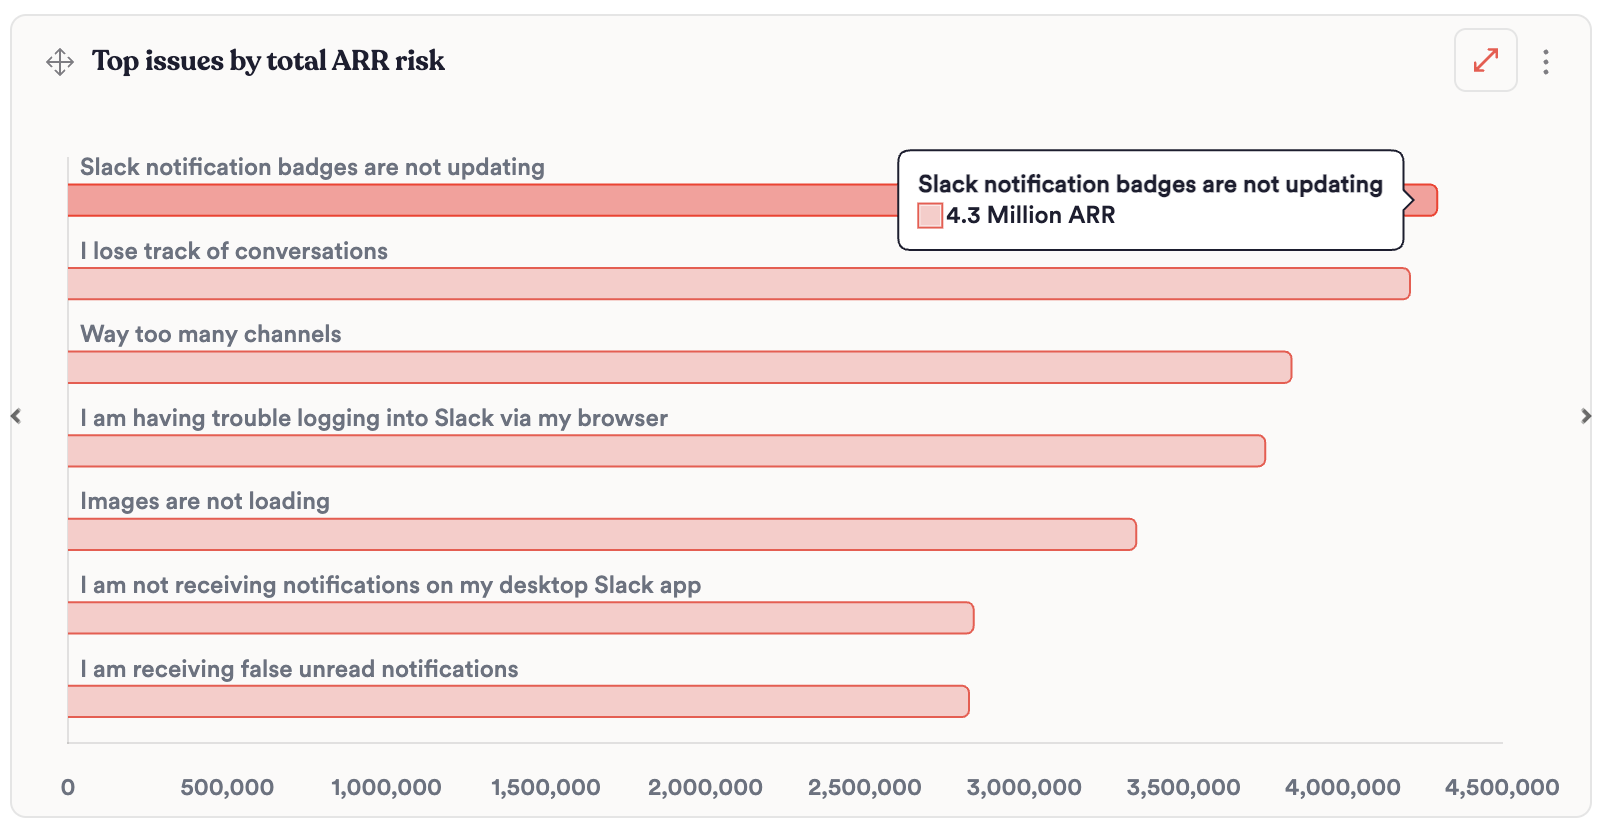
Weight insights by your business metrics
You can now weight the sorting of Groups by the business metrics that matter most to you.
For example, if you’d like to see the Groups in Unwrap that have the highest sum of revenue based on the customers who left that feedback in that Group, you can do that. Or create a chart showing the Unwrap Groups that have the lowest average NPS rating.
This feature allows you to weight by the sum or average of any numerical custom field.
New Integrations launched this month
- Gorgias
- Zendesk Talk
- Front
- Google Cloud Storage