Boards: Build Customer Feedback Dashboards
Last updated: November 14, 2026
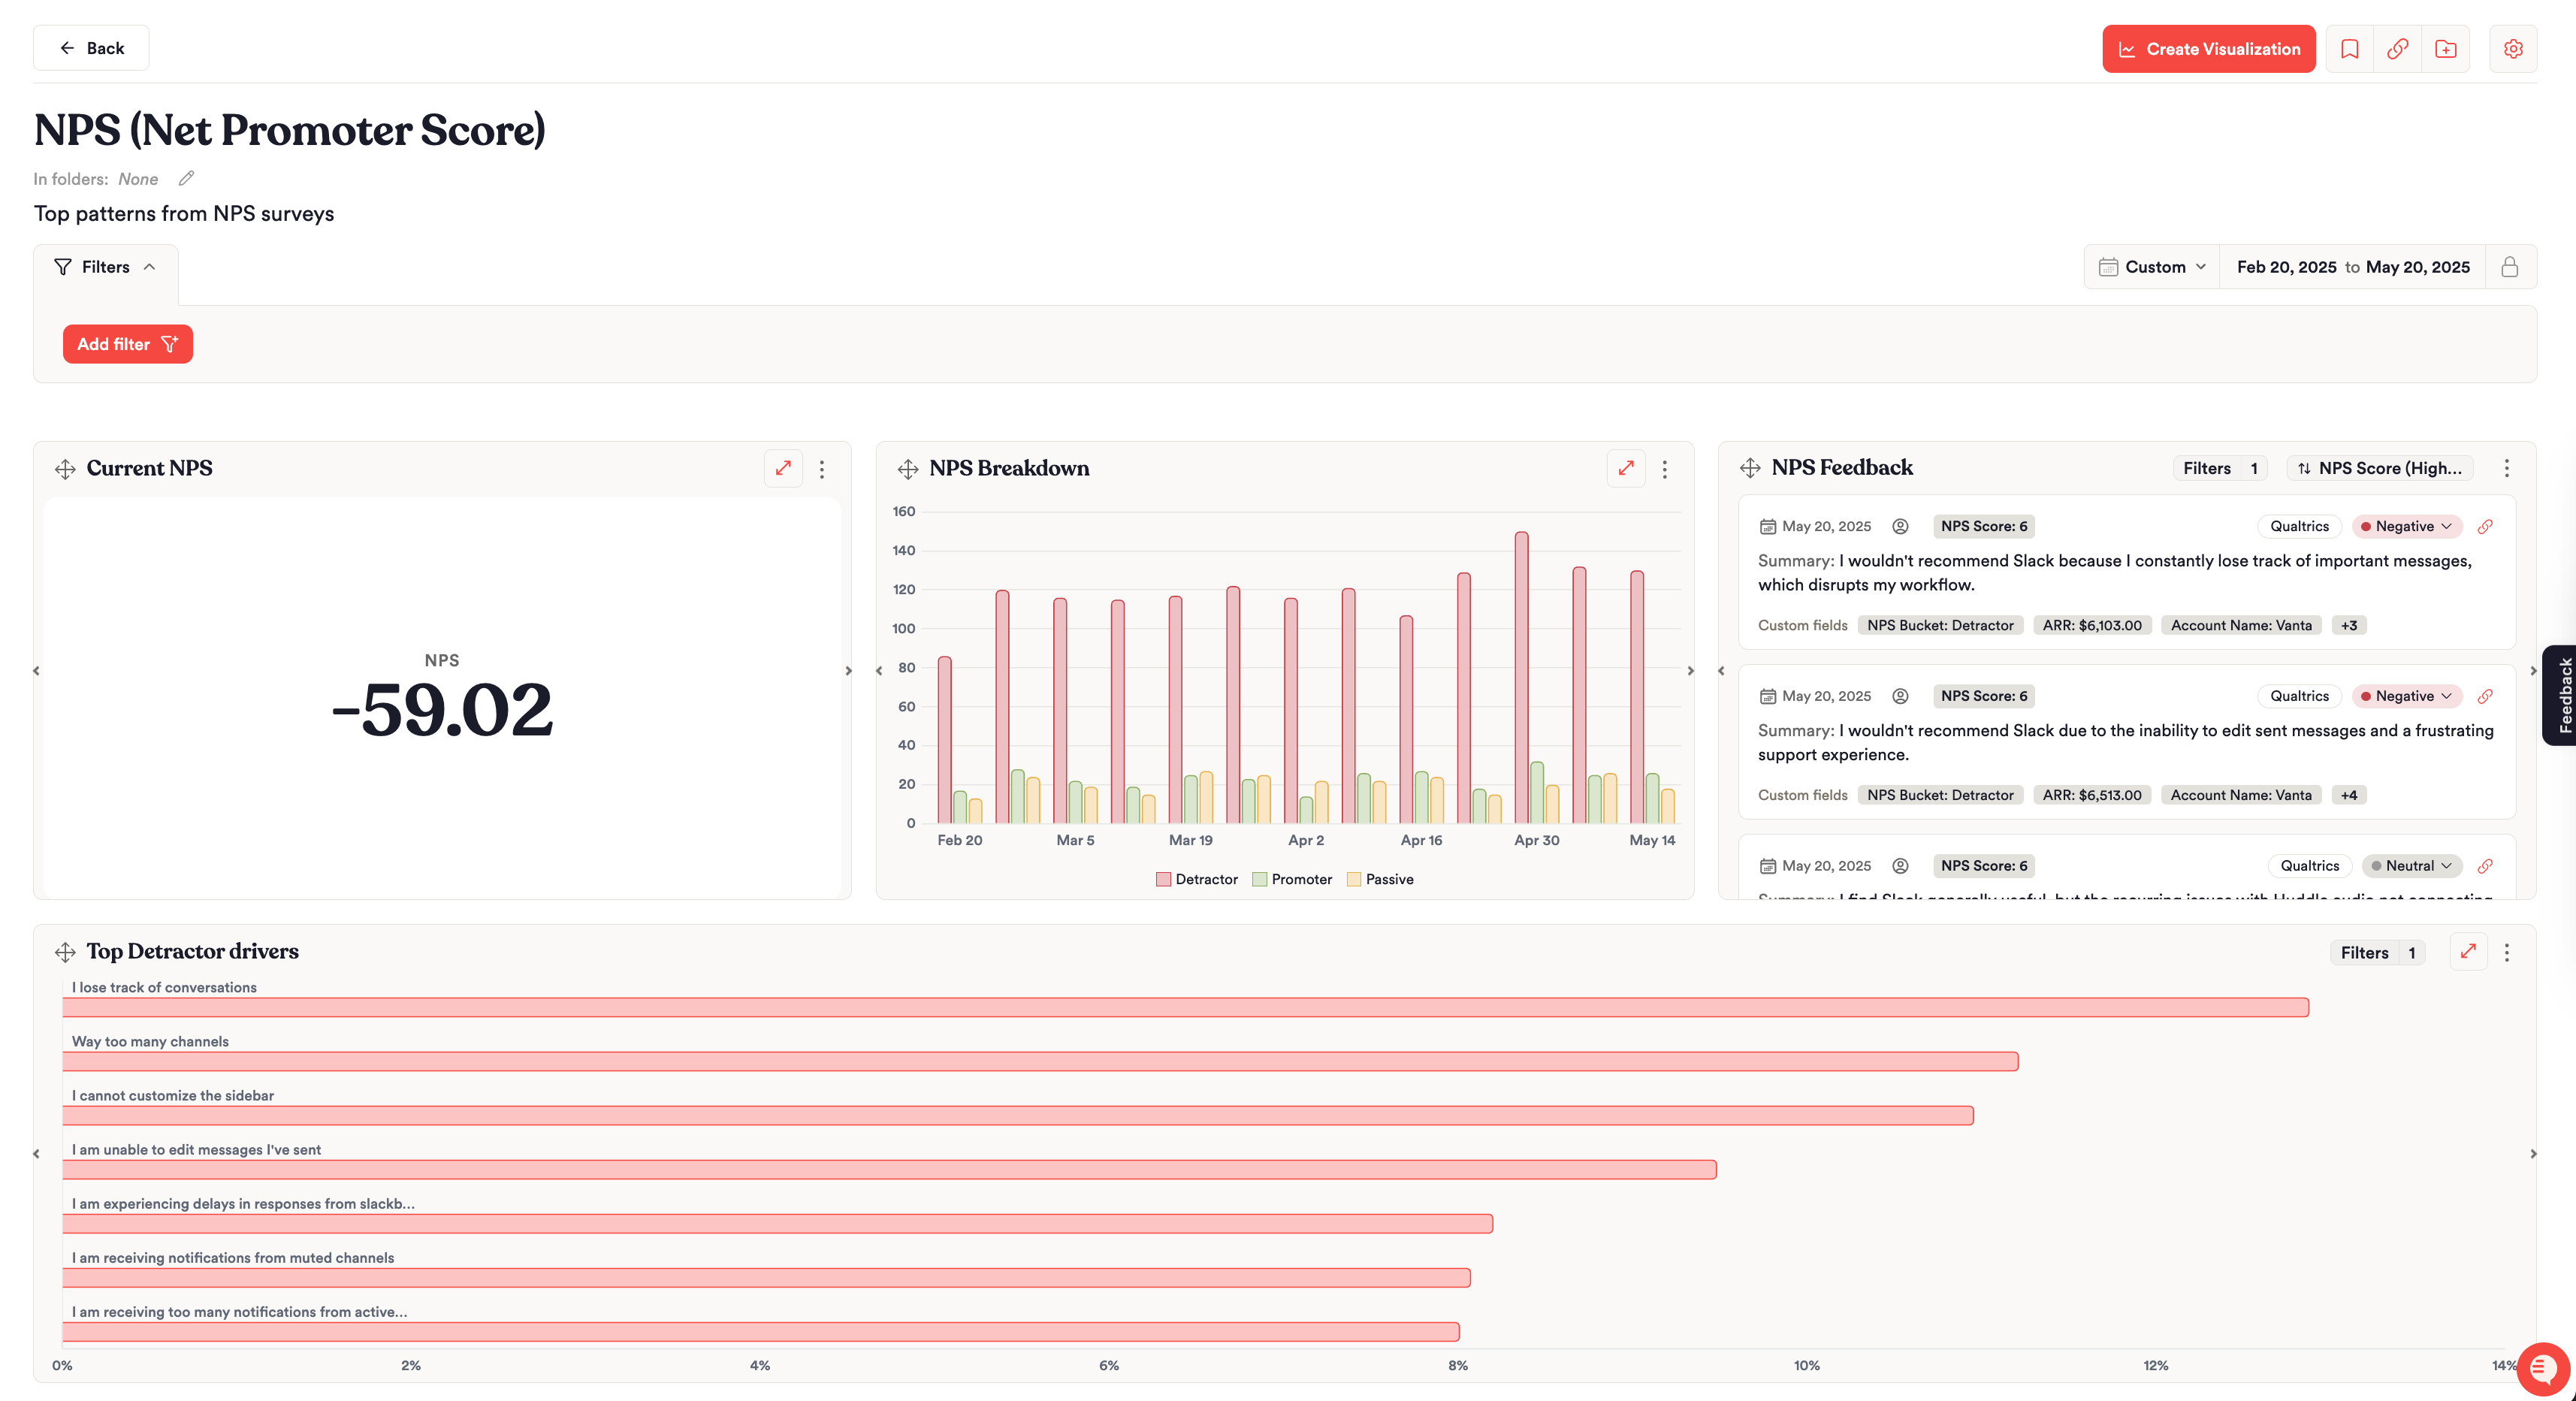
Boards are Unwrap's customer feedback dashboards. A Board is a collection of charts that tracks what customers are saying across every source you've connected, so your team and leadership can follow the issues and trends that matter to them.
Use a Board to track product performance, customer satisfaction or the patterns inside one feedback Group, and to tell a clear story with that data.
What a Board Shows
Each Board is made up of charts that plot your feedback data, with filters and breakdowns to segment it. You can also add section headings to group related charts, and a feedback list to show customer comments on the Board. Use Boards to:
Organize related charts into one dashboard
Tell a story with the trends and patterns in your data
Dig into insights with detailed breakdowns that reveal what's underneath a trend
Monitor the issues and events that matter most to your business
Share your data story with teammates or stakeholders
Before You Start
A few things make your first Board easier to build:
Connect your feedback sources. A Board charts the feedback already in Unwrap, so connect the sources you want to track first. See Adding Data.
Set up the custom fields you want to slice by, such as plan tier, region or product version. Only Admins can create or change custom fields, on the Integrations page. See Custom Fields.
Check your role. Viewers and Contributors can both create, edit and delete Boards and charts. Contributors can also edit the taxonomy. See Data organization and permissions.
Save filters you'll reuse. If you save a Board or chart that uses a personal saved filter, Unwrap shares that filter with everyone in the View.
New to Boards? Building a board: Getting started has a short video that walks through building your first Board.
Creating, Drafting and Publishing a Board
Go to the Boards page.
Click Create Board.
New Boards start as Drafts. Only you can see them, in My Drafts on the left. While a Board is a Draft, add charts (built yourself or saved from the Assistant), set board-level filters and a date range, and give it a title and description.
Click Publish to make it visible to your team. After you publish, you can add it to a folder, pin it to your Home page, duplicate it, copy a link, or export it as a PDF or PNG.
Org Admins can see which published Boards their team uses most on the Usage page. Boards with no activity in the selected date range are flagged there as cleanup candidates.
Board-Level Filters and Date Ranges
Board-Level Filters
Apply filters at the board level to scope every chart on the Board to one subset of feedback. For example, filter the whole Board to a single feedback source or to one custom field value.
Board-level filters apply across all charts on the Board. The same filters available on the Feedback page work here, including:
Source, Group and Descendants of
Sentiment (Positive, Neutral or Negative)
Feedback Type (Feature Request, Product Defect)
Business Impact (Churn Risk, Upsell Opportunity)
Custom fields from your integrations, such as plan tier or region
See Filtering Feedback for every filter in detail.
Date Range and Locking
Set or lock the date range across the whole Board, so every chart shows data for the same time period. Preset ranges run from the last 7 days to all time, and you can also set a custom date range for a specific period. Locking is optional. Use it when you need the Board to stay on one window, such as a quarter for a QBR. If you leave it unlocked, anyone viewing the Board can change the dates.
Recommended Charts
These 3 charts answer common questions and make a good starting point for a new Board.
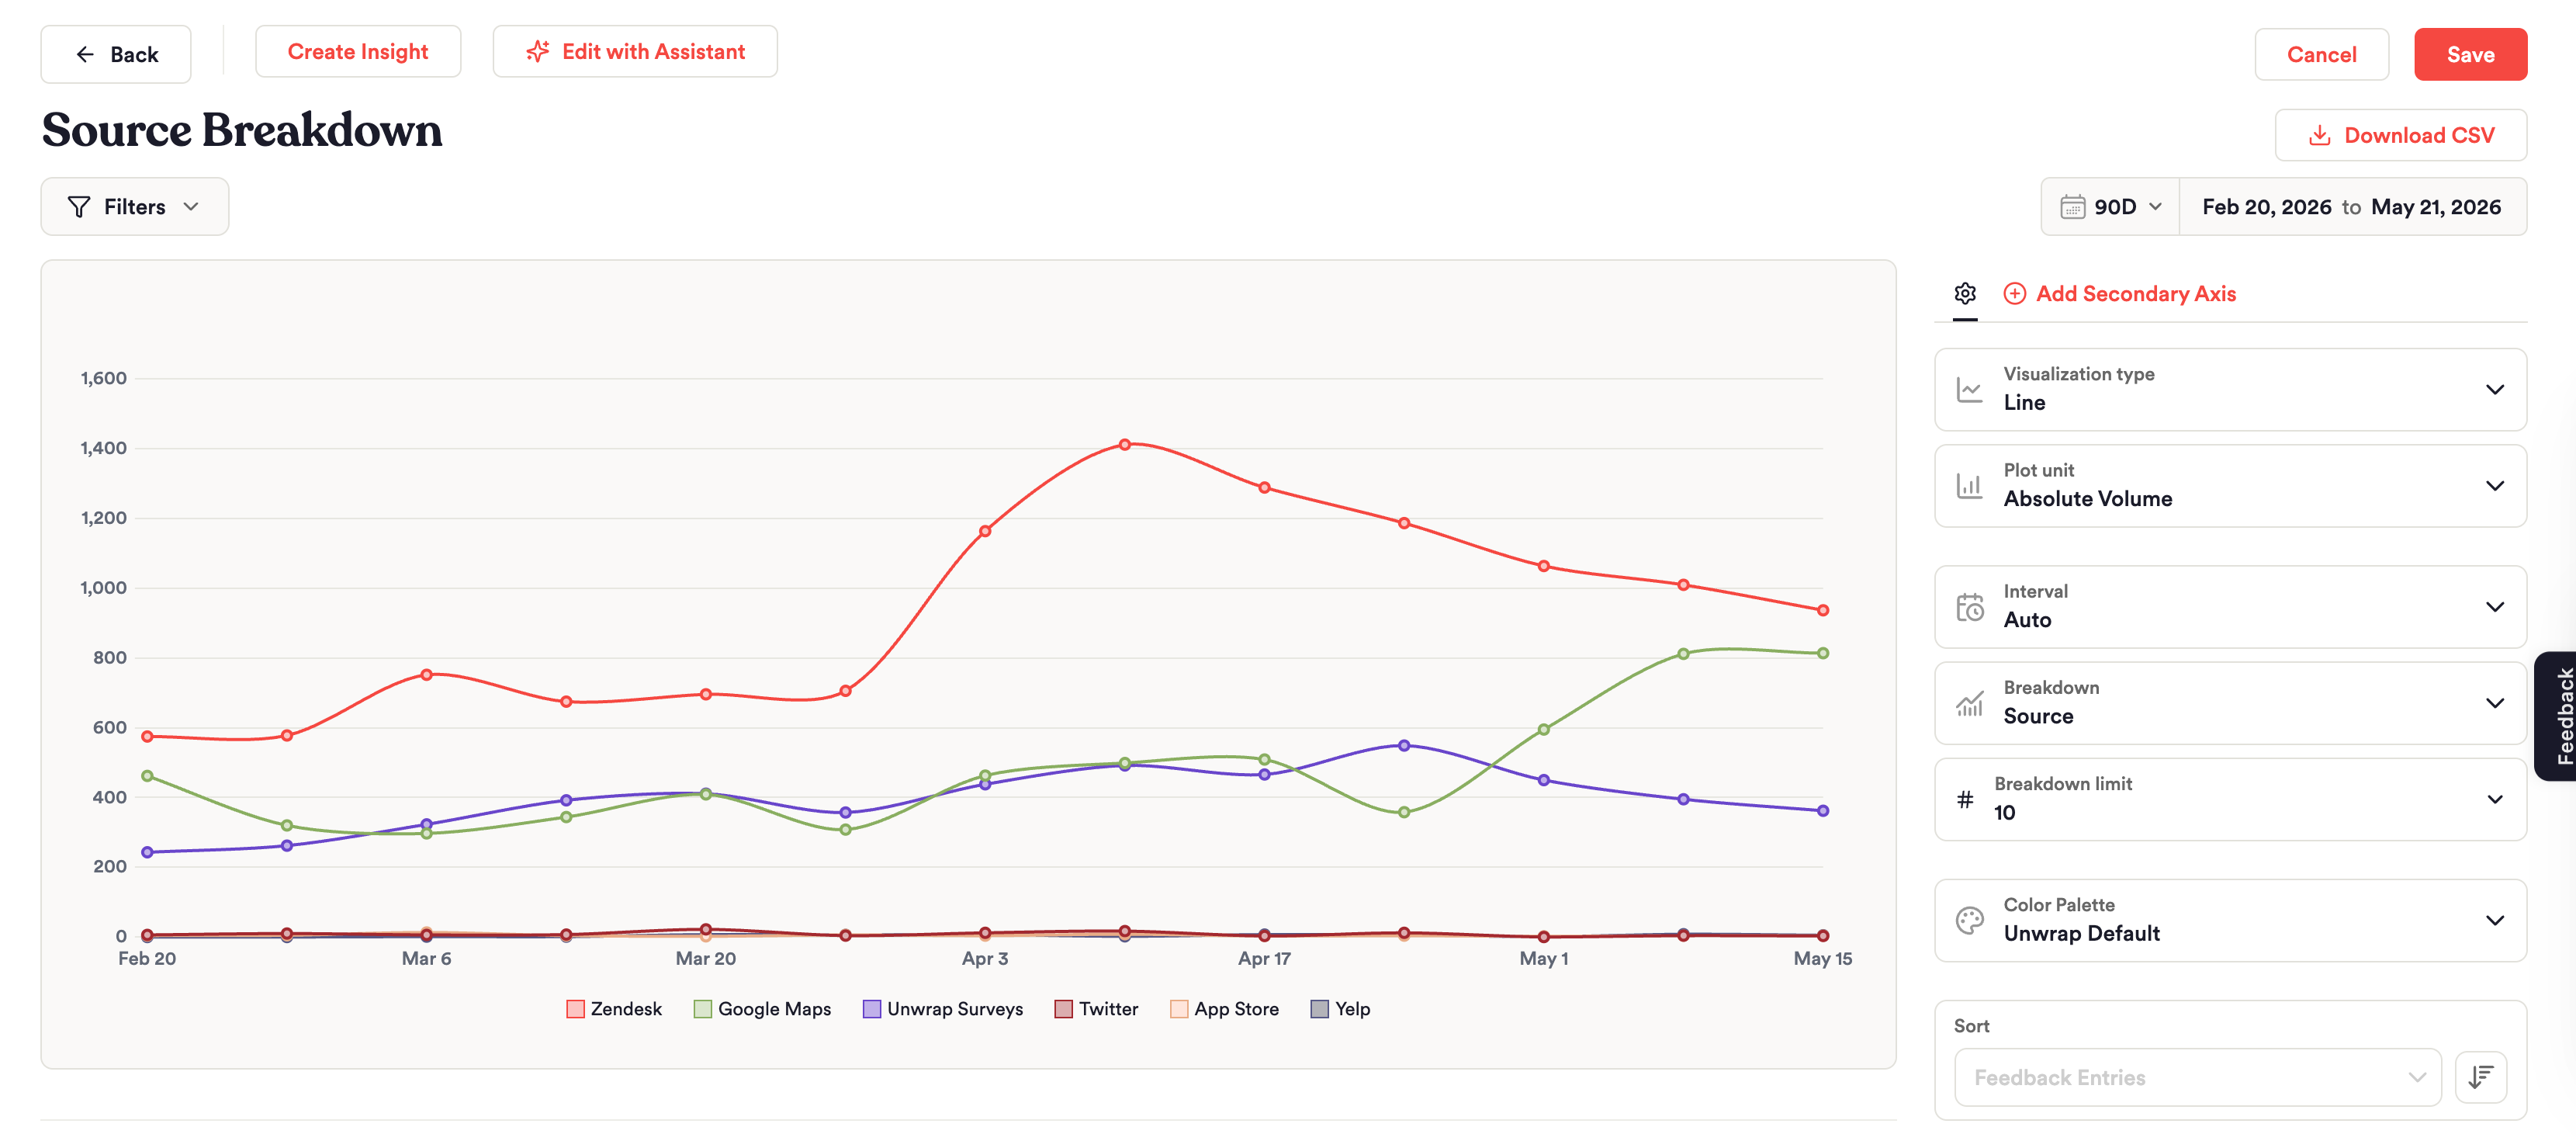
Overall Feedback by Source
To see how much feedback is coming from each integration:
Select Absolute Volume as your metric.
Choose a Line or Stacked Column chart type.
Add the Source breakdown.
This shows at a glance which channels (for example, App Store, Zendesk or Intercom) are driving the most feedback over time. To see each source as a share of all feedback instead of a count, use Percent of Feedback (%) as the metric instead of Absolute Volume.
Volume of an Issue by Source
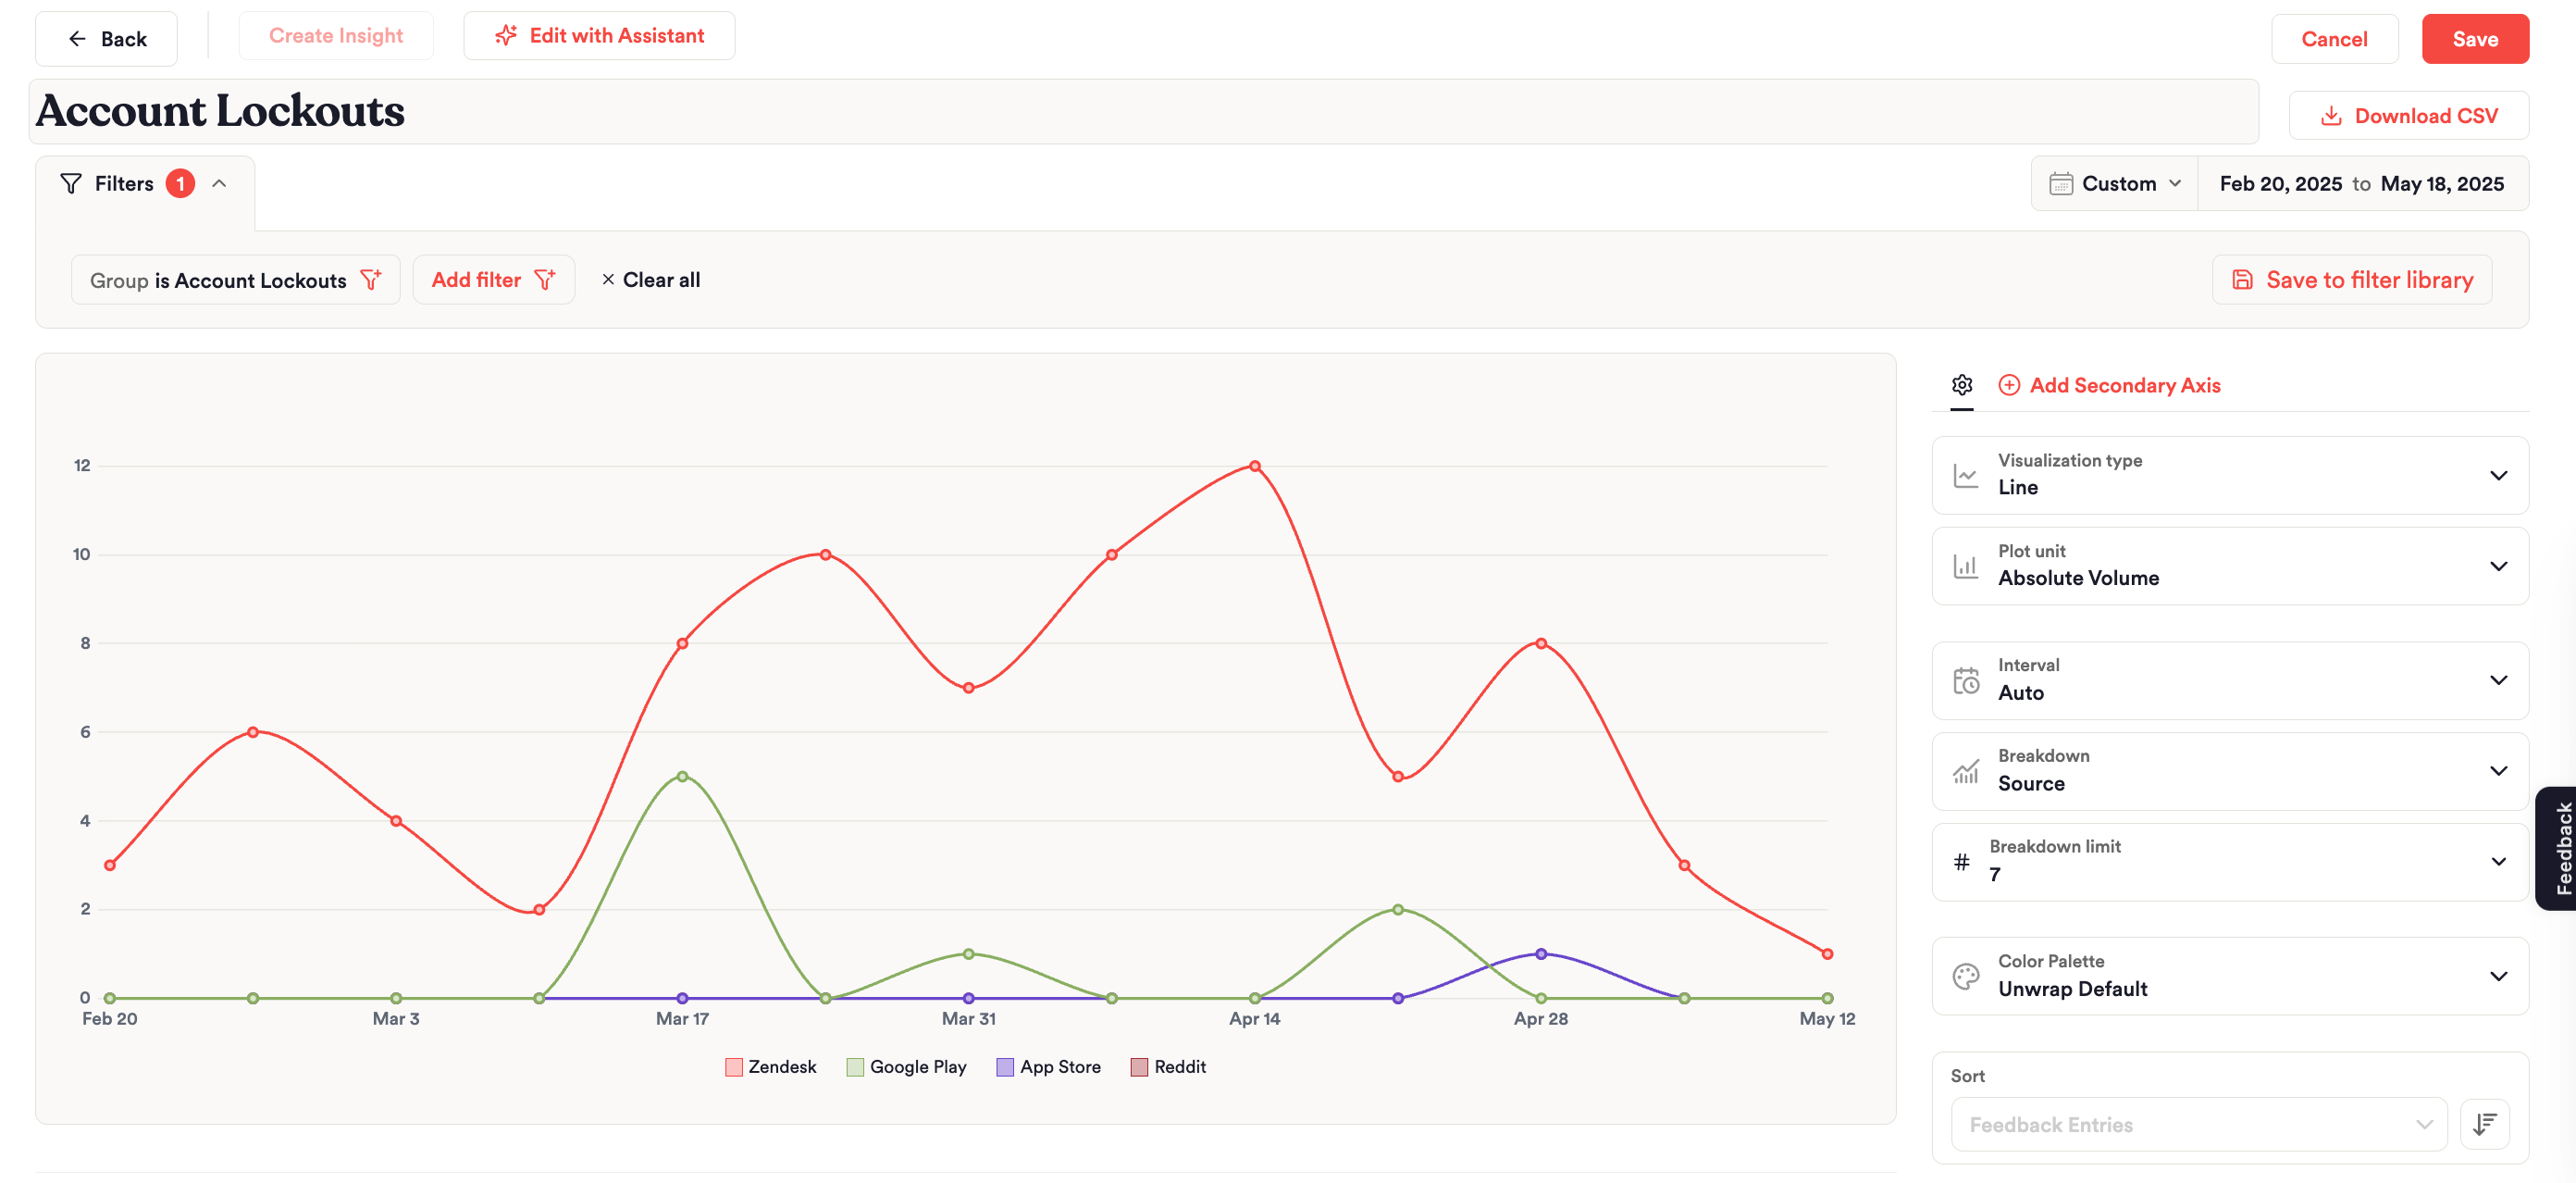
To see which platforms and feedback sources people use when they report an issue such as "Account Lockouts" and look for a resolution:
Filter the chart to the Group, in this case "Account Lockouts."
Plot Absolute Volume.
Break it down by Source.
In this example, Zendesk and Google Play surface more complaints about account lockouts than the Apple App Store.
Top Feedback Patterns by Enterprise Customers
To see which issues drive the most feedback from your enterprise customers:
Choose a Horizontal Bar chart type.
Select Absolute Volume as your metric.
Break it down by Non-Parent Groups.
Filter to your "Enterprise" segment.
This is a quick way to prioritize which problems to address for your highest-value customers.
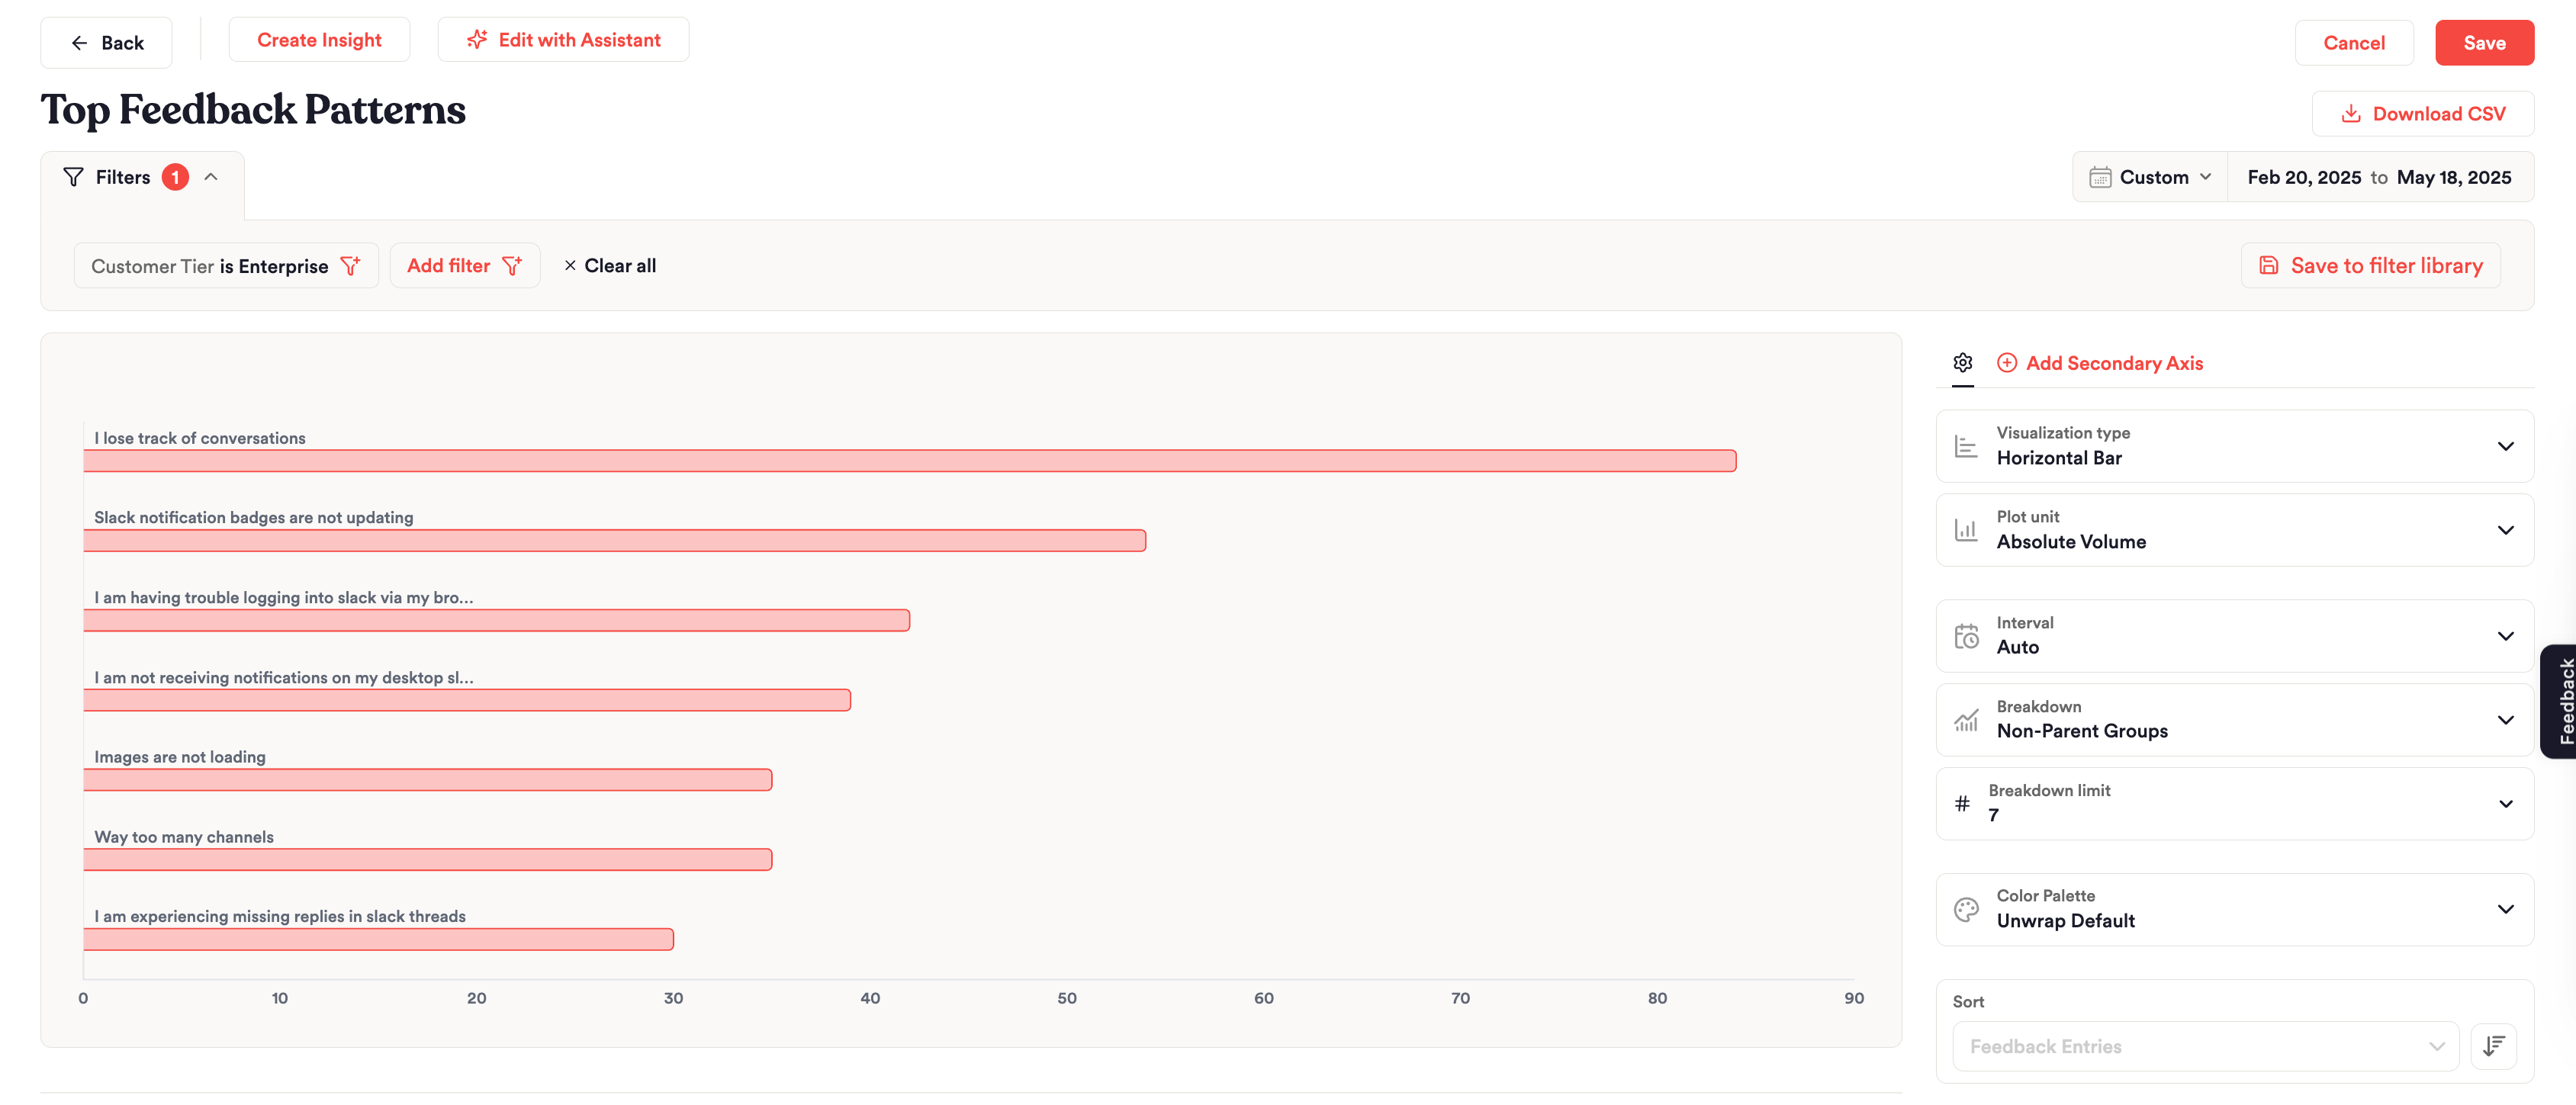
Chart Types and When to Use Each
Unwrap supports a range of chart types, so you can shape each chart to the question you're trying to answer:
Chart type | Best for |
|---|---|
Line | Showing change over time |
Stacked area | Showing how a mix changes over time |
Stacked column | Showing how a mix changes over time, as columns |
Clustered column | Comparing categories side by side |
Horizontal bar | Ranking values, such as top issues |
Pie | Showing proportional breakdowns |
Table | Displaying detailed data with sorting |
Big number | Showing a single metric at a glance |
Feedback list | Showing customer comments on the Board |
Chart Filters and Breakdowns
Chart-Level Filters
Beyond the board-level filters that apply to every chart, each chart can be filtered further to focus on a narrower set of feedback.
This helps when you want most of your Board to reflect one view, but one chart to zoom in on a Group, a source or a custom field value. Chart-level filters work in addition to any board-level filters already applied.
Breakdowns
Breakdowns split a chart by a dimension you choose, so you can compare how categories stack up against each other within the same metric.
For example, break a volume chart down by source to see how feedback is distributed across App Store, Google Play and Zendesk.
Available breakdowns include:
All Feedback (no split)
Source
All Groups
Non-Parent Groups, the most specific Groups with no children of their own
Children, which splits a chart by the immediate children of one Group. This option is available when the chart is filtered to a single Group.
Your custom fields, such as plan tier or region
Teams with Support IQ also get Agent and Performance Rating.
Sentiment is a filter and a plot unit (Positive Sentiment Rate), not a breakdown.
Plot Units
The metric on the chart is the plot unit. Common choices:
Absolute Volume: how much feedback
Percent of Feedback (%): that slice as a share of all feedback
Positive Sentiment Rate (%): how much of the feedback is positive
If you have NPS, CSAT or other numeric custom fields, those appear as plot units too. Some teams also get Resolution Rate, Quality Performance Rate or DSAT Rate.
Building Charts With the Assistant
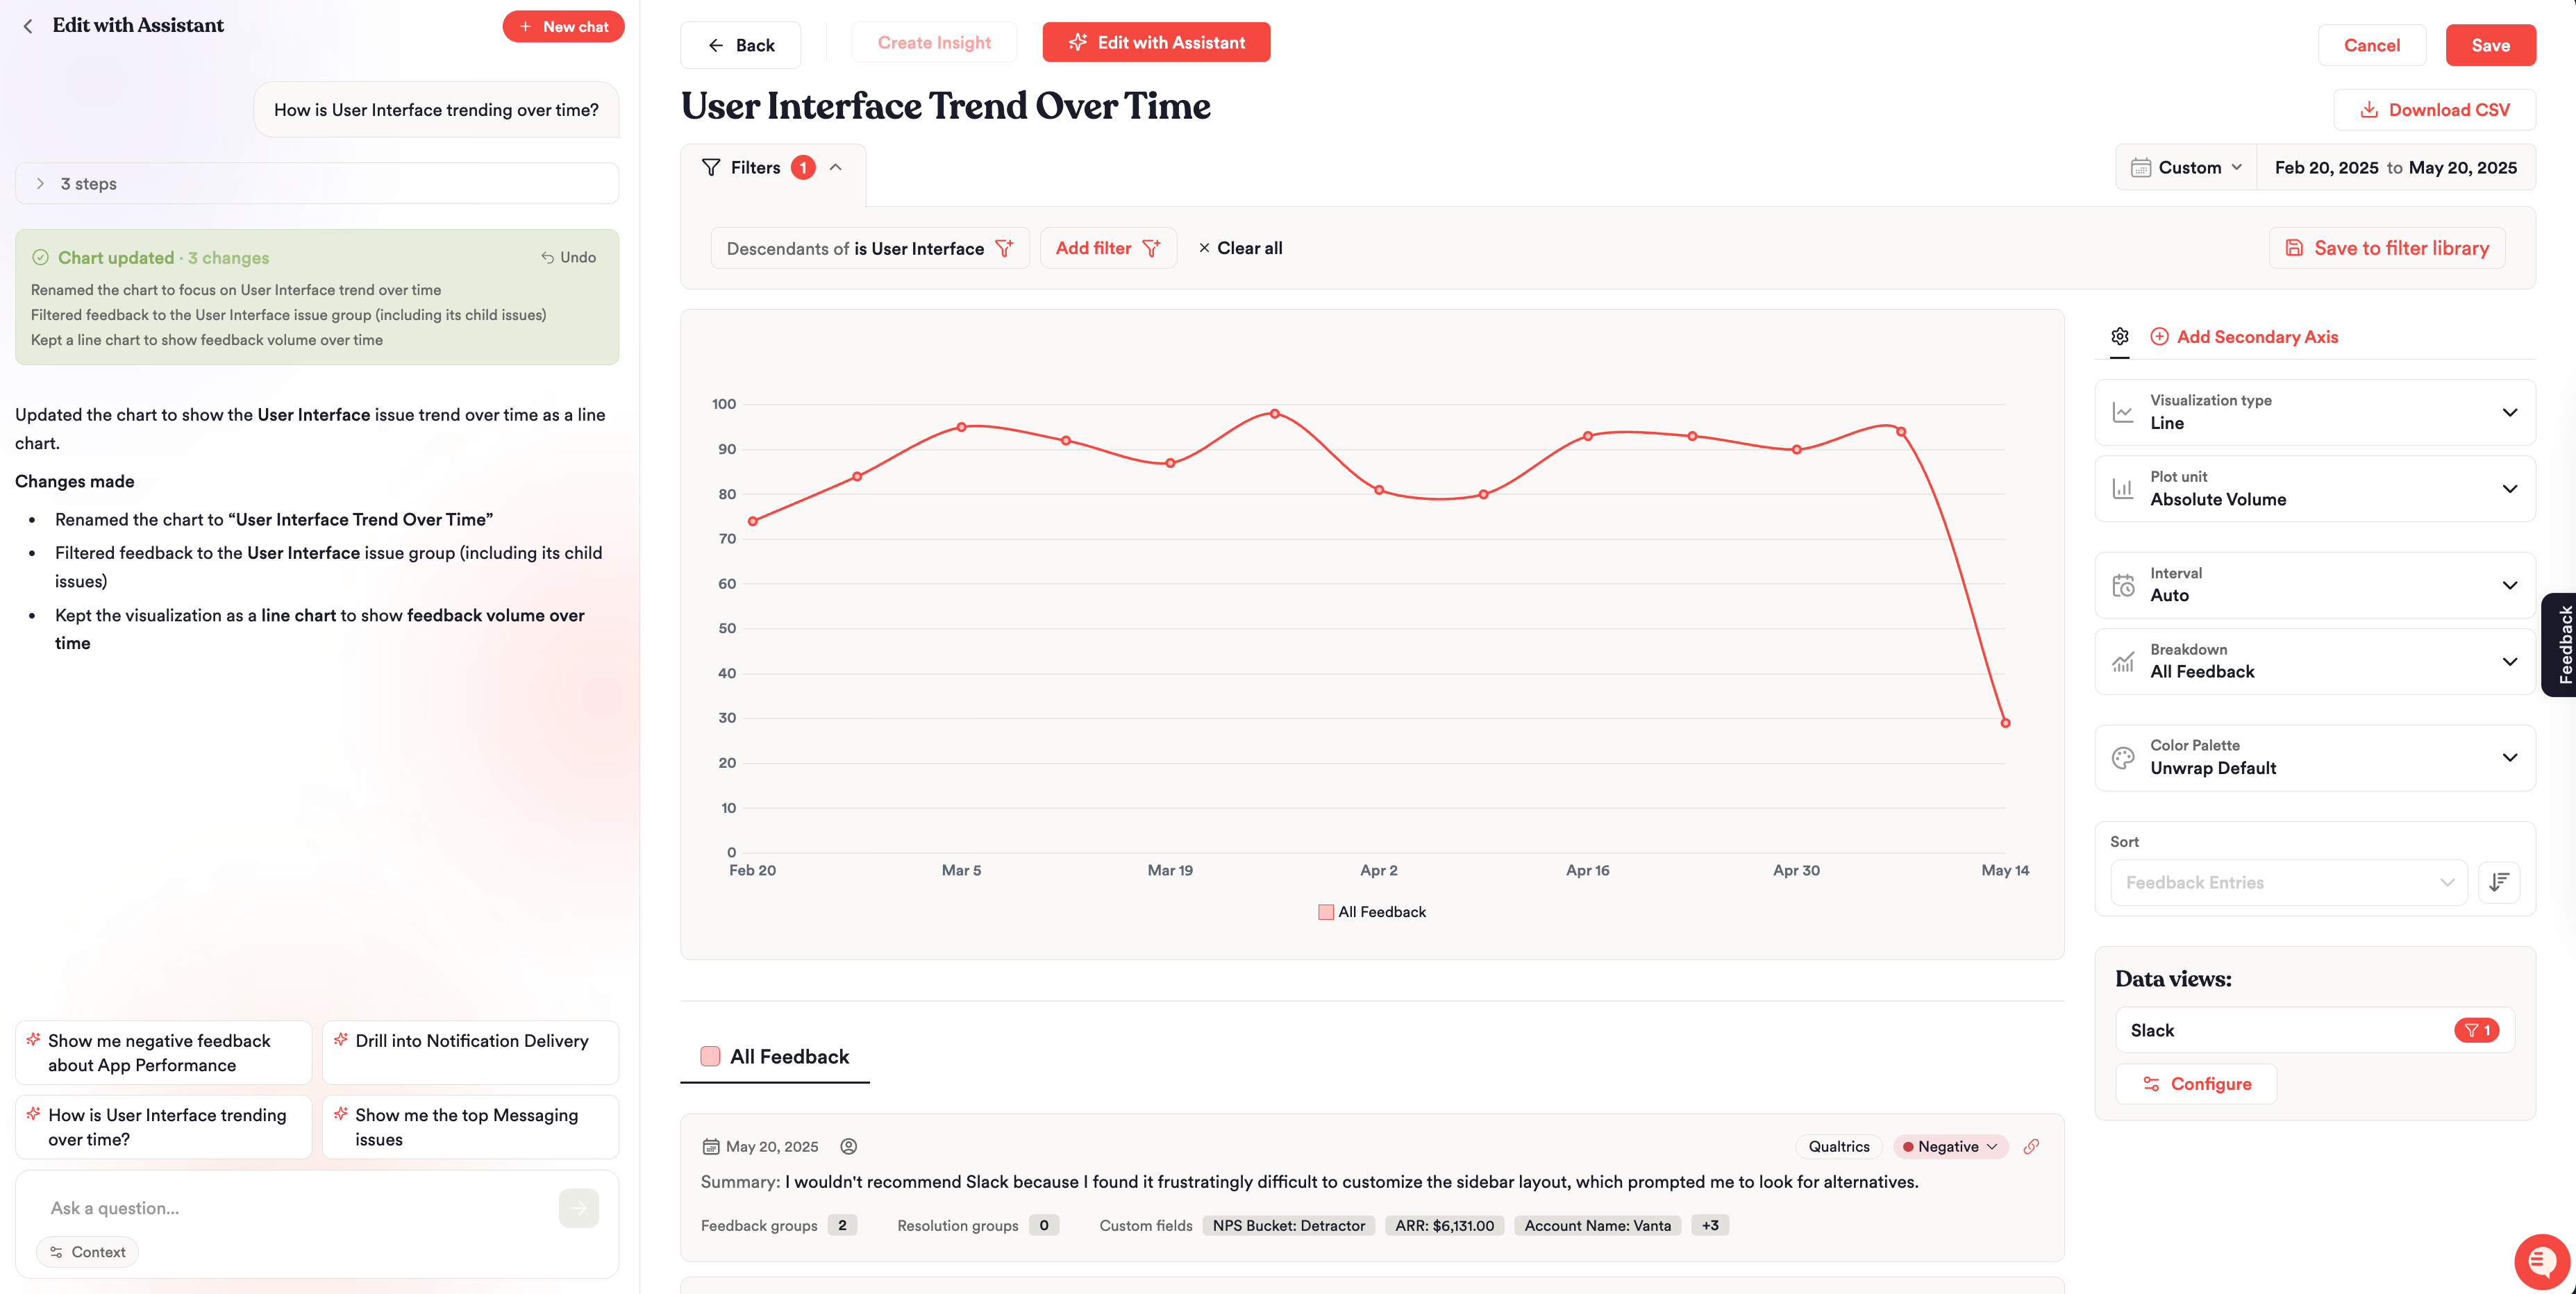
The easiest way to analyze your feedback and build charts is with the Assistant in the chart builder:
Click Edit with Assistant.
Describe in plain language the issue you want to analyze, or the chart you want, such as a new chart type, a breakdown, a filter or a date range.
Discuss and refine the chart in the conversation.
When you find an insight worth tracking, save the chart to a Board so you can come back to it.
Charts the Assistant generates in any conversation can also be added to an existing Board directly from that conversation. The Assistant can't build a new Board on its own yet, so create the Board first. See Unwrap Assistant: Ask Questions About Your Customer Feedback.
FAQs
Who Can See My Board?
New Boards start as Drafts that only you can see. Once you publish a Board, you can share it with teammates and stakeholders. After you publish, add the Board to a folder if you want teammates to find it next to related Boards.
Why Does One Chart Show Different Numbers From the Rest of the Board?
Chart-level filters stack on top of board-level filters. A chart with its own Group, source or custom field filter shows a narrower slice of feedback than the charts around it.
Can I Make Every Chart Cover the Same Time Period?
Yes. Set or lock the date range at the board level, and every chart shows data for that same period.
Can I Add a Chart From an Assistant Conversation to a Board?
Yes. Charts produced by the Assistant can be added to any existing Board straight from the conversation.
How Do I Send Board Insights to Leadership on a Schedule?
Boards are for exploring and monitoring. To send a written summary with charts by email or Slack on a schedule, turn an Assistant conversation into a report and subscribe to it. See Reports.
Can I put customer comments on a Board, not just charts?
Yes. In the chart type dropdown, choose Feedback list. The widget shows matching entries on the Board, using the same filters.